
I’m always curious to learn how things work, so I thought it would be fun to crack open the lid on Core ML to get a feel for how it does things.
In this blog post we’ll take a quick look at the insides of Core ML models, and at what happens on the device and the GPU when you run a model. Don’t worry, you don’t need to be a Metal expert to follow along.
Why do this? It’s fun. And understanding how Core ML works under the hood also makes it easier to troubleshoot any problems you might encounter in getting your model to work.
Note: The information here is provided for educational / entertainment purposes only. Many of these implementation details will probably change with new iOS and Xcode releases, so don’t do anything in your app that depends on them.
What is in a .mlmodel file?
To use a machine learning model with Core ML it needs to be in mlmodel format. You can use the coremltools Python package to convert your trained models into this format. But what exactly is such a .mlmodel file?
The mlmodel file format is based on protobuf. You can download the mlmodel specification here. When you unzip this folder it contains a bunch of .proto files. The main one is Model.proto and it includes all the others.
You can open these files with a text editor and look inside. Here’s an excerpt:
message Model {
    int32 specificationVersion = 1;
    ModelDescription description = 2;

    // start at 200 here
    // model specific parameters:
    oneof Type {
        // pipeline starts at 200
        PipelineClassifier pipelineClassifier = 200;
        PipelineRegressor pipelineRegressor = 201;
        Pipeline pipeline = 202;

        // regressors start at 300
        GLMRegressor glmRegressor = 300;
        . . .
Everything that Core ML supports is described by these proto files. If it’s not in here, Core ML does not support it.
I suggest reading through these proto files, there are a lot of comments explaining how everything works. For example, if you’re interested in using Core ML for deep learning, check out NeuralNetwork.proto to see all the neural network layers you can use.
While these proto files are useful for understanding the possibilities and limitations of Core ML, we can also use them to look inside mlmodel files. After all, an mlmodel file is nothing more than a binary file in this protobuf format (protobuf is like JSON but more expressive, smaller, and faster).
We first have to compile the proto files. If you haven’t got it already, first install the protobuf compiler (I used homebrew):
$ brew update
$ brew install protobuf
I’m going to use Python to load and examine the mlmodel file, so we also need to install the protobuf library for Python:
$ pip3 install -U protobuf
Now go into the mlmodel_specification folder (the one containing the proto files) and run the following command:
$ protoc --python_out=. *.proto
This will create a _pb2.py file for every proto file. The protobuf compiler turns every definition from the proto files into an object that you can use from Python.
Create a new Python script with the following contents:
import os
import sys
import Model_pb2

model = Model_pb2.Model()

with open("Inceptionv3.mlmodel", "rb") as f:
    model.ParseFromString(f.read())
The line import Model_pb2 loads the file we just generated from Model.proto (which in turn imports all the others). The Model_pb2 module contains a Model class that can be used to load an mlmodel file, in this case Inceptionv3.mlmodel from developer.apple.com/machine-learning/.
The nice thing about protobuf is that it hides all the parsing logic. To read the mlmodel file, you simply use native objects that look exactly the same as the definitions in the proto files.
Model.proto contains a Model definition with a description property. To print out the value of this property, you only have to add this line to the script:
print(model.description)
Now if you run the script it will print a description of the Inceptionv3 model (it takes a few seconds to actually read the mlmodel file):
input {
  name: "image"
  shortDescription: "Input image to be classified"
  type {
    imageType {
      width: 299
      height: 299
      colorSpace: RGB
    }
  }
}
output {
  name: "classLabelProbs"
  shortDescription: "Probability of each category"
  type {
    dictionaryType {
      stringKeyType {
      }
    }
  }
}
output {
  name: "classLabel"
  shortDescription: "Most likely image category"
  type {
    stringType {
    }
  }
}
predictedFeatureName: "classLabel"
predictedProbabilitiesName: "classLabelProbs"
metadata {
  shortDescription: "Detects the dominant objects present in an image
  from a set of 1000 categories such as trees, animals, food, vehicles,
  person etc. The top-5 error from the original publication is 5.6%."
  author: . . .
}
This is the same meta information that Xcode shows when you select the mlmodel file in the Project navigator.
You can also dig deeper into the model to see what sort of layers it contains, and what their properties are.
The Model object can be one of several types (as you can see in Model.proto). The Inceptionv3 model is of the type NeuralNetworkClassifier. And if you look in NeuralNetwork.proto you’ll see that the NeuralNetworkClassifier object has a layers property that consists of NeuralNetworkLayer objects.
Let’s have a look at those layer objects, for example to print out the sizes of all the convolution layers:
for layer in model.neuralNetworkClassifier.layers:
    print(layer.name)
    if layer.HasField("convolution"):
        print("\tis convolution")
        print("\tkernel size:", layer.convolution.kernelSize)
        print("\tinput channels", layer.convolution.kernelChannels)
        print("\toutput channels", layer.convolution.outputChannels)
This prints:
convolution2d_1
	is convolution
	kernel size: [3, 3]
	input channels 3
	output channels 32
convolution2d_1__activation__
batchnormalization_1
convolution2d_2
	is convolution
	kernel size: [3, 3]
	input channels 32
	output channels 32
convolution2d_2__activation__
. . .
batchnormalization_94
mixed10
avg_pool
flatten
predictions
predictions__activation__
That looks like the Inception architecture all right. 😄
For your own models, writing a script like this can be useful to check exactly what the coremltools conversion process did, and to verify that it really included all the layers.
One important thing with Core ML is that, for models that take images, the input image is converted into the format that the model expects. To verify what sort of preprocessing your model does, you can write:
print(model.neuralNetworkClassifier.preprocessing)
For Inceptionv3 this prints out:
[scaler {
  channelScale: 0.007843137718737125
  blueBias: -1.0
  greenBias: -1.0
  redBias: -1.0
}
]
This means Core ML first multiplies every pixel with 0.007843 — which happens to be 1/127.5 — and then subtracts 1.0 from every color channel. So effectively this scales pixels from the range [0, 255] to the range [-1, 1].
I hope the above has shown that reading the protobuf data into a Python script makes it possible to inspect your Core ML mlmodel files. You could also use this method to change the mlmodel if you were so inclined — or even create one from scratch.
GUI tools for inspecting protobuf files also exist, which admittedly is easier than writing a Python script to dig through the model, but I haven’t found one yet that I liked. Suggestions are welcome. 🤗
Note: You can even convert the proto files to Swift (or pretty much any other language). Instead of outputting Python code you can use protoc to generate Swift classes and structs that let you load the mlmodel file into Swift and examine its contents. Read more here
mlmodelc
It might surprise you to learn that, after all the effort you’ve gone through to create your mlmodel file, that this file is not actually included in your app bundle when you ship it to the App Store. Instead, Xcode runs a compiler on the mlmodel file to create a .mlmodelc folder — and that is what goes into your app bundle.
Let’s take Inceptionv3 again. When you add Inceptionv3.mlmodel to your project and build the app, Xcode performs the following build steps:
/Applications/Xcode.app/Contents/Developer/usr/bin/coremlc generate
/path/to/Inceptionv3.mlmodel ... --language Swift --swift-version 4.0

/Applications/Xcode.app/Contents/Developer/usr/bin/coremlc compile
/path/to/Inceptionv3.mlmodel ...
This first generates the Inceptionv3.swift source file containing the MLModel wrapper class, and then it compiles the mlmodel file into the mlmodelc folder and adds it to the app bundle.
Note: This also explains the need for calling MLModel.compileModel(at) when you download a mlmodel file over the air. Core ML does not work with the mlmodel file directly, first it needs to be translated into an mlmodelc.
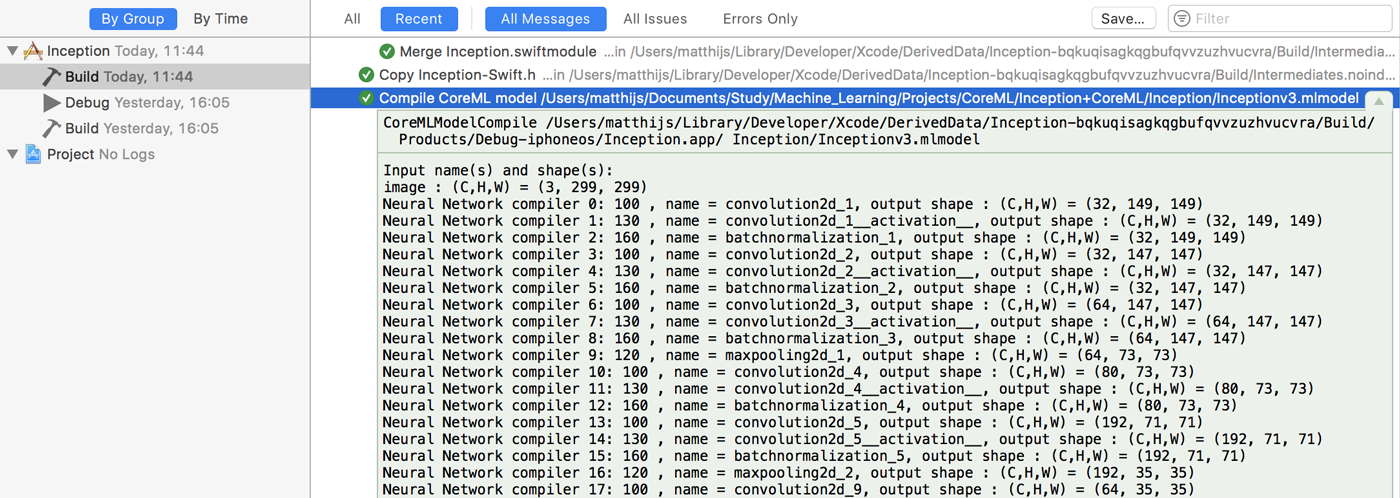
It’s worth looking at the output of the model compilation step (in the Xcode Report navigator), as it shows the names and sizes of the layers:
Let’s look at this mlmodelc folder. If you open your .app file in Finder and choose Show Package Contents, it will show what is inside your app bundle:
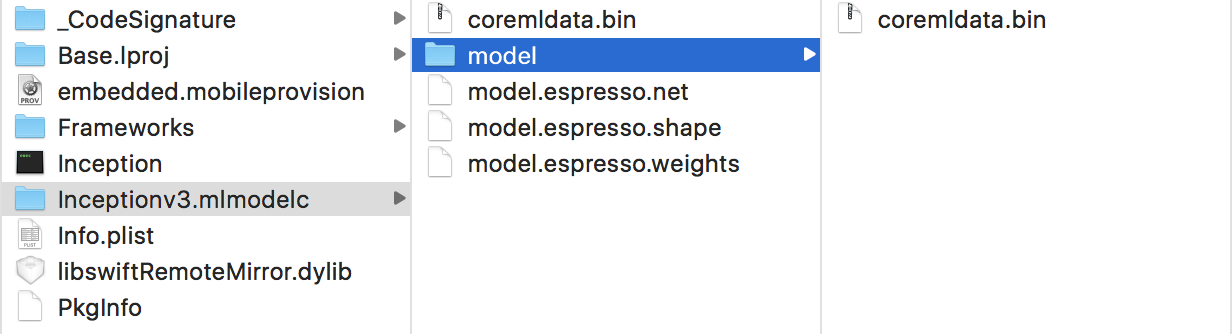
The Inceptionv3.mlmodelc folder contains the following files:
- coremldata.bin: this appears to be the model’s metadata (name of author etc) and the classification labels
- model.espresso.net: describes the structure of the model, i.e. which layers it uses and how they are connected to each other
- model.espresso.shape: the output sizes of the layers in the neural network (the same thing you saw in the output of the build step above)
- model.espresso.weights: the learned parameters of the model (this is usually a big file, 96MB for Inception-v3)
- model/coremldata.bin: ?
“Espresso” is apparently the internal name Apple uses for the part of Core ML that runs neural networks (we’ll see this term again later on).
Let’s take a quick peek inside model.espresso.net. It’s a regular text file that looks like this:
{
  "storage" : "model.espresso.weights",
  "properties" : {

  },
  "format_version" : 200,
  "layers" : [
    {
      "pad_r" : 0,
      "fused_relu" : 1,
      "fused_tanh" : 0,
      "pad_fill_mode" : 0,
      "pad_b" : 0,
      "pad_l" : 0,
      "top" : "convolution2d_1__activation___output",
      "blob_weights" : 3,
      "K" : 3,
      "blob_biases" : 1,
      "stride_x" : 2,
      "name" : "convolution2d_1",
      "has_batch_norm" : 0,
      "type" : "convolution",
and so on… It’s again a listing of all the model’s layers but this time stored in a JSON format rather than protobuf.
Why have two different formats for the same thing? I think mlmodel is supposed to be an open, standard file format, so that other tools can load mlmodel files too (allowing you to use your mlmodel files on Android or Linux, for example.) On the other hand, mlmodelc is a proprietary format that is optimized for Apple devices and is specific to iOS.
Another reason to compile mlmodel to a private format is that often optimizations can be made — such as “fusing” different layers together — to reduce inference time. For example, if the mlmodel specifies that a convolution layer is followed by a scale layer, then the Core ML compiler could remove that scale layer and instead make the weights of the convolution layer larger or smaller. The result is the same but it saves a computation step.
That’s all I wanted to say about mlmodelc for now. There’s not much you can do with this knowledge anyway… It’s mildly interesting to look at the mlmodelc for your model, and it may help with troubleshooting models that don’t behave as they should, but it’s probably best not to mess too much with this part of Core ML.
What happens when you run the model?
Let’s spy a little on Core ML to see what it does when you use the model to make predictions. Of course we don’t have the source code to Core ML, but we can still look at a stacktrace to find some clues as to how it works.
I used my Inception+CoreML project and set a breakpoint on the following line inside predict(pixelBuffer) in ViewController.swift:

What sort of secrets might the stacktrace reveal? This project uses the Vision framework to drive Core ML. In particular I’m interested to see how Vision resizes the image we give it (usually a CVPixelBuffer object).
Turn off optimizations, build the app, and run. The app will pause on the call to handler.perform([request]). Press the Step Into button in the debugger toolbar a few times and you’ll get a stacktrace like this:
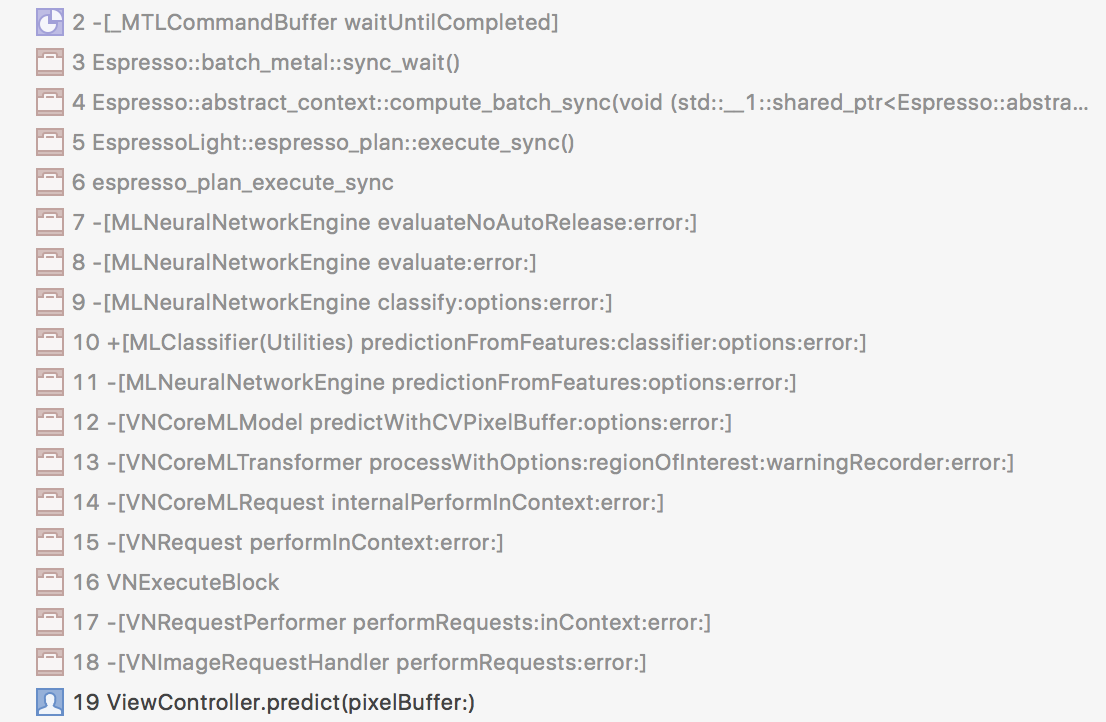
There are a few class and method names here that catch my eye:
[VNCoreMLTransformer processWithOptions:regionOfInterest: warningRecorder:error:]This just might be the method that scales our image to Inception’s input size of 299×299 pixels.[VNCoreMLModel predictWithCVPixelBuffer:options:error]This appears to be a private method onVNCoreMLModel; you’re not supposed to call it yourself. (In fact, a lot of the things in the stacktrace appear to be private.)[MLNeuralNetworkEngine predictionFromFeatures:options:error:]This looks like the class that actually runs the neural network.Espresso::abstract_context::compute_batch_syncThere is Espresso again. This is C++ code. Espresso appears to be the Core ML wrapper around the low-level Metal Performance Shaders. (How do I know Espresso uses MPS? Step the debugger a few more times and you’ll seeEspresso::MPSEnginepop up in the stracktrace.)
So what happens here is that first Vision resizes the image, then gives it to MLNeuralNetworkEngine, which uses Espresso to read the neural net definition from the model.espresso.net file, and finally MPS does the actual work of running the neural net on the GPU.
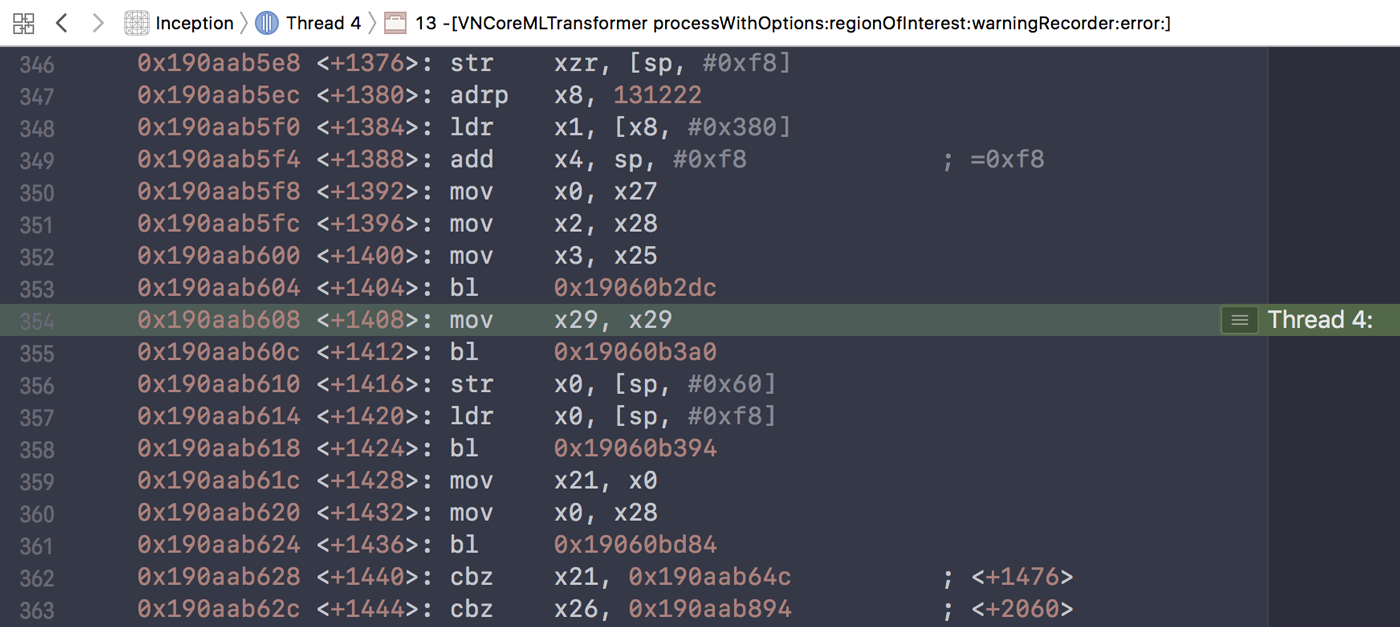
It’s possible to step through all of these methods in detail but it will look like the following, which isn’t really helpful (unless deciphering assembly is your thing):
Just for giggles I set a symbolic breakpoint on CVPixelBufferLockBaseAddress. This is the function you’d need to use to read to pixel data from a CVPixelBuffer (such as the one that contains our input image).
It was a good guess because this breakpoint indeed does get hit. The function that calls it is [VNImageBuffer croppedBufferWithWidth:height:format:cropRect: options:error], which in turn gets called from the [VNCoreMLTransformer processWithOptions:...] method we saw earlier.
So we’ve found the function that resizes the input image. This means Vision does the image resizing and cropping on the CPU, not on the GPU. Is this important to know? Probably not, but I wanted to know anyway.
I was also curious to see what would happen in an app that does not use Vision but calls Core ML directly. So I set a breakpoint on the line,
try? model.prediction(image: resizedPixelBuffer)
and now the stacktrace skips all of the Vision stuff (obviously) and immediately calls [MLNeuralNetworkEngine predictionFromFeatures:options:error:]. This is why you need to resize the CVPixelBuffer yourself when you use Core ML directly instead of going through Vision.
The GPU is where the magic happens
Core ML can run models on the CPU or on the GPU. For some models it makes more sense to use the CPU, but for (deep) neural networks the GPU is the tool of choice. Xcode comes with a GPU Frame Capture button that lets us inspect what the GPU is doing, and we can use this to spy on Core ML some more.
To enable GPU Frame Capture in a Core ML app, you need to add a few lines of code (for example, inside the main view controller):
import Metal

var device: MTLDevice!
var commandQueue: MTLCommandQueue!

// in viewDidLoad():
device = MTLCreateSystemDefaultDevice()
commandQueue = device.makeCommandQueue()
This is enough to make Xcode enable the GPU Frame Capture button in the debugger toolbar:
Run the app, press the GPU Frame Capture button to start capturing, wait a second or so, and press the button again to stop. Of course, you actually need to be doing a Core ML prediction while the capture takes place (in my app it does a prediction on every video frame, so we’re good there).
Note: Xcode 9 beta 5 crashes the app when doing this on Core ML directly but it works fine when using Vision and VNCoreMLModel.
Now Xcode will show what the GPU was doing during the capture:
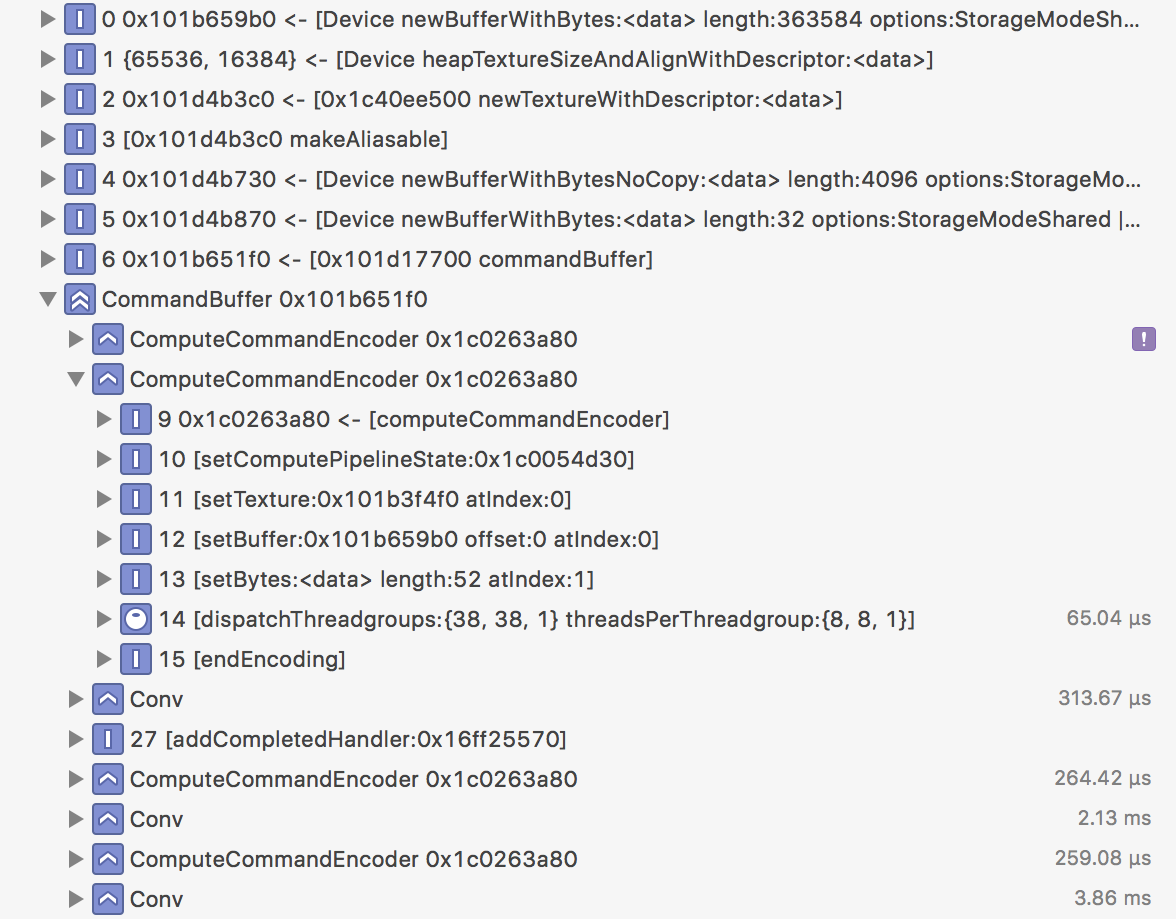
This tells you what compute commands were added to the Metal command buffer and how long each took. In the screenshot above, which is again from Inceptionv3, it is clear that the Conv blocks for the convolution layers take up most of the time.
By expanding an item you can see which Metal kernel function was used and what its parameters were. For some reason the first ComputeCommandEncoder item is empty but the second one looks as follows:
The kernel function is TARR_vimage2espresso. Hey, it’s “espresso” again!
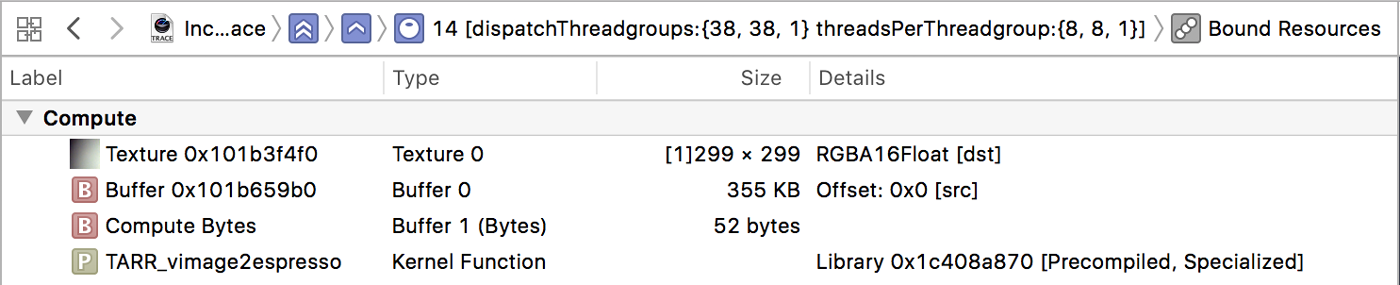
This compute kernel reads from a 355 KB memory buffer (Buffer 0) containing the input image and writes to a 299×299-pixel texture (Texture 0). Recall that the input image must already be resized at this point — it’s easy to verify this: 299×299 pixels times 4 bytes per pixel takes 355 KB of storage, which indeed is the size of the input buffer.
You can double-click on the textures and buffers to see what’s inside. For example, if you double-click on Buffer 1, you get this:
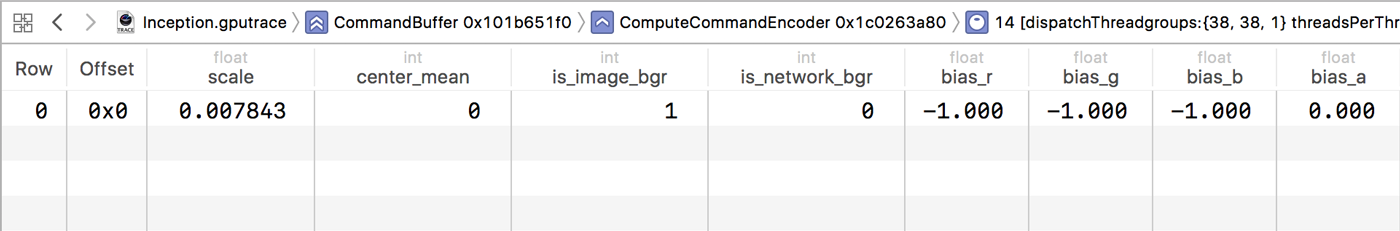
These are the parameters that are passed into this compute kernel. Here we see the preprocessing settings for this model: scale of 0.007843, RGB bias of -1.0, and a few other ones. We’ve already seen that Vision scales the image on the CPU but the rest of the preprocessing apparently happens on the GPU.
Convolution kernels
Let’s now turn our attention to the Conv command encoders. These have kernel functions with exotic names such as cnnConvArray_3xIn_16xOut_1_3 and cnnConvArray_8xIn_8xOut_1_2. I’m not sure exactly what these numbers mean, but it’s clear that MPS has several different compute kernels to do convolution, each tailored to specific circumstances.
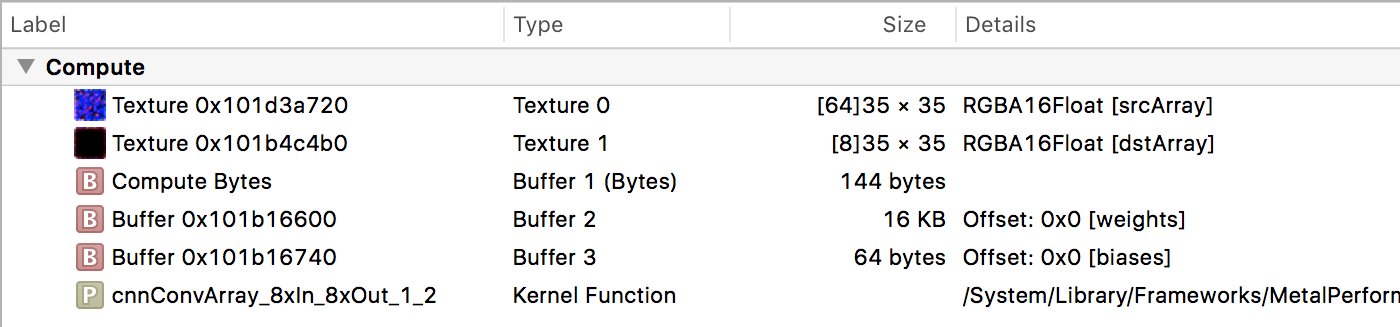
A convolution kernel reads from a texture and writes to a new texture. It also takes three buffers: Buffer 1 contains the kernel size, stride, activation function values, and so on (double-click the buffer to check it out); Buffer 2 contains the convolution weights; and Buffer 3 contains the bias terms.
In the Xcode debug pane you can find more info about this compute kernel and its bound resources. In particular, the Function section is interesting:
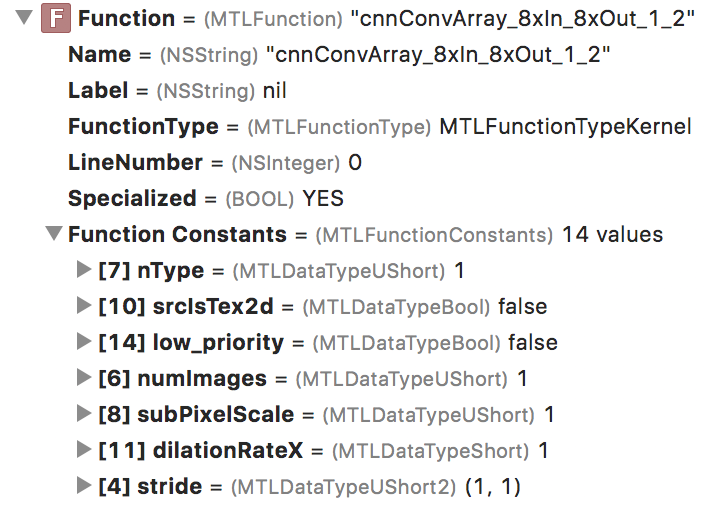
Expand this item to reveal additional parameters under Function Constants. For this compute kernel, the value of nType is 1. With a little bit of experimentation I found out that nType stands for “neuron type” and 1 means ReLU. So this nType value tells you what the activation function is for this layer.
From this we can conclude that in MPS the activation function is “fused” into the convolution kernel, such that both operations — convolution and activation — can be done in a single step, which is much more efficient than doing them separately. Good to know!
How many threads?
Another interesting thing to look at is the size of the threadgroups for this compute kernel (in the Debug navigator pane):
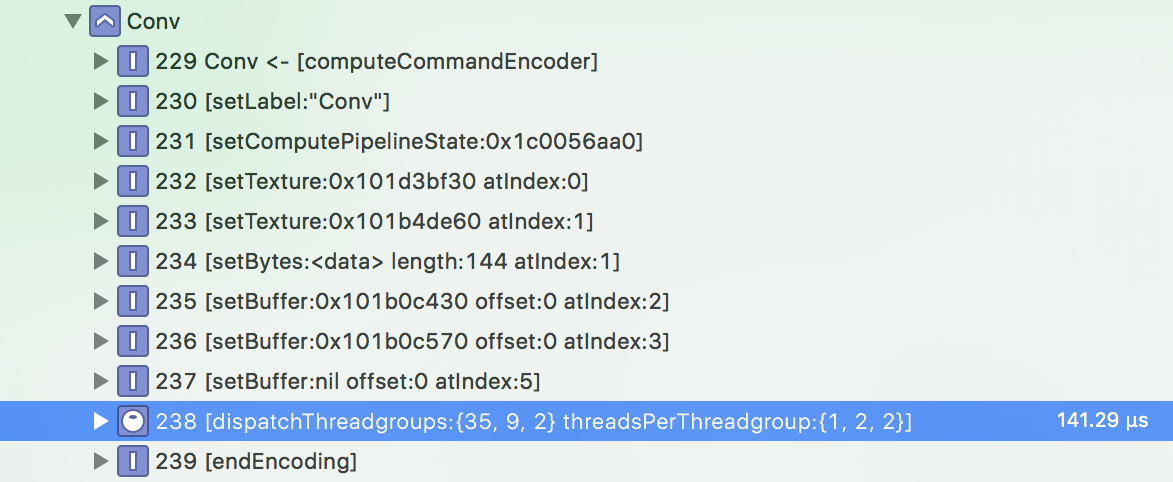
The whole point of using the GPU for these kinds of jobs is that the GPU is massively parallel: the same compute kernel will be performed by many threads in parallel, and each thread works on a small piece of the problem. In the case of a convolution layer, each thread computes a pixel in the output texture. Threads are dispatched by the GPU in groups.
In this case each threadgroup contains 1×2×2 = 4 threads and there are 35×9×2 = 630 groups. So in total there are 630 × 4 = 2520 threads launched to perform this particular convolution. Where do these numbers come from? You’d have to ask the Apple engineers who wrote these MPS kernels, but presumably they were chosen because they give the best performance on a problem of this size, on this particular device (10.5-inch iPad Pro).
As I mentioned, MPS has several compute kernels for performing convolutions under various circumstances, and these kernels have been tweaked to run as fast as possible on different hardware and with different image sizes. (It’s quite possible you’ll see different threadgroup sizes on your device for this compute kernel.)
Still, we can guess at what these numbers might mean. The size of a threadgroup is given in three dimensions, so we’ve got 35×1 threads working on the width of the image, 9×2 threads on the height, and 2×2 threads on the depth. In this case, the input texture is 35×35 pixels and has 48×4 = 192 channels. The output texture is also 35×35 but only has 32 channels.
Putting all these numbers together would mean that each thread does one pixel horizontally (the width is 35 and we’ve got 35 threads working in that dimension) and two pixels vertically (the height is also 35 but we’ve only got 9×2=18 threads working in that dimension, so 18 threads doing 2 pixels each covers those 35 pixels). And each thread writes the results for 32 / 2×2 = 8 output channels. Sounds reasonable. 🤓
Batch normalization and layer fusion
There are also other ComputeCommandEncoders in the list. The ones that follow convolution layers are named TARR_batchnorm_inference_kernel. That makes sense because Inceptionv3 uses batch normalization after every convolution layer.
However, I find it interesting than Core ML does not optimize these layers away. When batch normalization occurs before the activation function, it is possible to “fold” the batch norm layer into the preceding convolution layer. The Keras model that Inceptionv3.mlmodel is based on does indeed apply batch norm before the ReLU activation. But for some reason, the TARR_batchnorm_inference_kernel happens after the ReLU. Curious…
When I ran GPU Frame Capture on another model that applies batch normalization, no batch norm layers showed up in the capture. For that model CoreML was able to optimize them away, so why not for Inceptionv3?
The answer to this conundrum lies in the .mlmodel dump we did earlier on. Notice that there the activation function also happened before batch norm:
convolution2d_1
convolution2d_1__activation__
batchnormalization_1
As it turns out, the GitHub history for inception_v3.py shows that an earlier version of the model did put batch norm after the ReLU, but since then they’ve switched it around. So that explains it: Apple used that previous version of the script, not the current one.
I hope this is a useful demonstration of why sometimes it makes sense to look at what happens to your model at runtime.
In this case, Inceptionv3.mlmodel could be made faster by using the updated version so that the batch norm layers can be folded away, which saves a bit of inference time. Inceptionv3 has about 90 convolution layers, and if batch norm takes 150 μsec on average (it depends on the size of the layer) then that saves about 14 ms per frame. That’s a significant gain…
Other compute kernels
Another interesting compute kernel that we find in the frame capture results is TARR_concat_kernel_f16_4inputs. This takes four source textures and combines them into one output texture. This kind of copy operation shouldn’t be necessary since MPS has a destinationFeatureChannelOffset property that lets neural net layers write directly into a larger texture, avoiding the need for a separate “concat” operation.
To be fair, destinationFeatureChannelOffset only works when the number of channels in each layer is a multiple of 4. That happens to be true for Inceptionv3, but not for all models, so maybe Core ML is just playing it safe.
There is also a TARR_flatten_nhwc kernel that does not seem to be needed. Flattening is an operation done in Keras to reshape the output of a convolution layer so that it can be connected to a fully-connected layer. But with Metal this is not needed.
The presence of these extra concat and flatten layers does explain why Core ML is often a little slower than running the same model implemented directly in Metal. (You can see this speed difference for yourself in the Tiny YOLO repo. For some reason in that model the ReLU activation function is not fused with the convolution and sits in its own separate layer.)
Finally, the very last compute kernel is read_tex2darray_4f_unpacked. This takes the texture from the softmax layer, which is 1×1 pixels but with 1000 channels, and converts it to a memory buffer containing 32-bit floating point numbers. This buffer is what gets handed back to Core ML and Vision.
And that’s it! Hopefully you found it fun to dig through the things that happen when you run a Core ML model. Even you don’t need to know any of this stuff in order to use Core ML, it can be handy when you’re debugging why your model doesn’t work as expected. And curious cats just want to know! 😹
First published on Monday, 21 August 2017.
If you liked this post, say hi on Twitter @mhollemans or LinkedIn.
Find the source code on my GitHub.
 New e-book: Code Your Own Synth Plug-Ins With C++ and JUCE
Interested in how computers make sound? Learn the fundamentals of audio programming by building a fully-featured software synthesizer plug-in, with every step explained in detail. Not too much math, lots of in-depth information! Get the book at Leanpub.com